If you are trying to make sense of the Rockville Centre housing market, one number will not tell the whole story. As a homeowner, you want a clear read on whether demand is still strong, how much leverage buyers have, and what today’s conditions could mean for your next move. This guide breaks down the market signals that matter most in Rockville Centre and shows you how to read them with more confidence. Let’s dive in.
Why Rockville Centre Needs a Closer Look
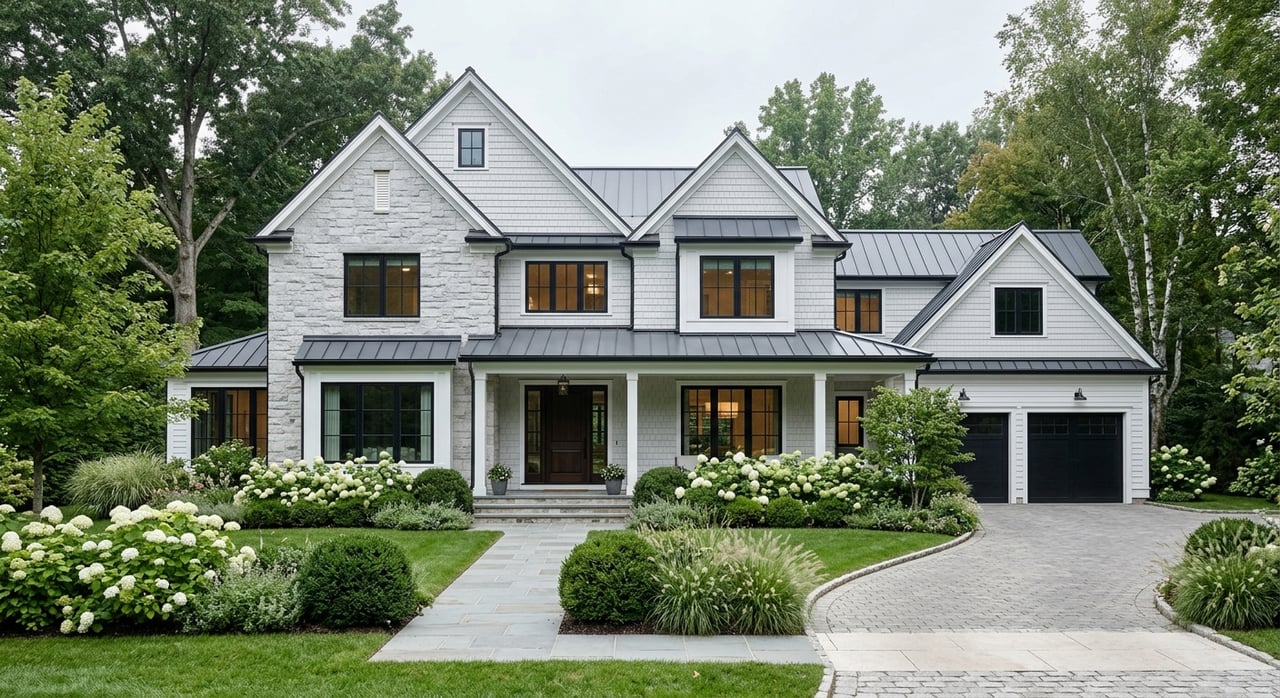
Rockville Centre is best read as a small local market, not just a ZIP code on a chart. The Village of Rockville Centre notes that the community is made up primarily of one-family homes, along with some town houses, condominiums, and apartments.
That distinction matters because some South Hempstead streets also use the 11570 ZIP code even though they are outside the village boundary. If you rely on ZIP-based public data alone, the picture can blur slightly. For homeowners, the best approach is to keep the geography consistent whenever you compare trends.
The village’s Long Island Rail Road access also plays a role in demand. Rockville Centre lists an approximate 35-minute train ride to Manhattan, which helps support interest from commuters and cross-market buyers looking at both Long Island and the city.
Start With the Right Market Signals
Before you read the market, it helps to know what the common terms actually mean. Public websites often use similar language, but the way they calculate the numbers is not always identical.
Inventory or active listings means the number of homes currently for sale on a given day. Days on market, often called DOM, tracks the median time from a home’s initial listing until it closes or is removed from the market. Sale-to-list ratio shows how close the final sale price came to the asking price.
There is also cumulative days on market, or CDOM, which can be especially useful when a home is relisted. In OneKey MLS, active listings begin at 0 DOM, pending listings pause the clock, and CDOM follows the property across listing cycles rather than just the current listing.
Why Public Numbers Can Differ
If you have ever compared Zillow, Realtor.com, and Redfin and wondered why the numbers do not match exactly, you are not imagining it. The platforms track the market using different methods.
Realtor.com says its data library is built from MLS-listed homes for sale, and its active listing count is a snapshot. Zillow’s home value index is based on monthly property-level Zestimates rather than closed sales. Redfin combines MLS and public-record calculations.
The practical takeaway is simple. In a small market like Rockville Centre, it is better to read public data directionally than treat any single portal as absolute truth.
Inventory in Rockville Centre
Current public snapshots point in the same general direction, even if the raw counts differ. Zillow showed 56 homes in for-sale inventory and 21 new listings as of April 30, 2026, while Realtor.com showed 73 homes for sale in March 2026.
That gap may seem large at first glance, but small geographies can swing quickly. A difference of only a handful of listings can change the tone of the market, especially in a compact village where supply is limited.
It also helps to remember that inventory is not just a head count. It is a supply-and-demand measure, which is why pace matters as much as the number of homes currently on the market.
How to Think About Supply
Redfin’s market tracker described 4 to 5 months of supply as a balanced market in mid-April 2026, with lower numbers pointing toward seller’s market conditions. That framework is helpful because it shows why a market can feel tight even when there appear to be a fair number of listings online.
In Rockville Centre, limited housing stock and a compact footprint can keep supply constrained. Even if active listings rise modestly, the market can still remain competitive if buyer demand stays steady.
For broader context, Nassau County had 3,556 homes for sale in April 2026, with a median listing price of $898,000 and median days on market of 46 days. Rockville Centre is much smaller, so month-to-month changes can look more erratic than the county as a whole.
Days on Market and What They Mean
Days on market can tell you a lot, but only if you read the number in context. In March 2026, Realtor.com reported Rockville Centre at 46 median days on market, while Redfin showed about 45.5 average days to sell and a median of 48 days on market.
That is roughly in line with Nassau County, which was also at 46 days, and faster than the New York statewide figure of 57 days in March 2026. In other words, Rockville Centre homes are generally moving at a healthy pace relative to the broader state.
Still, DOM is not a simple scorecard. A longer timeline can point to overpricing, but it can also reflect seasonality, a higher price point, or a more specialized property with a smaller buyer pool.
Seasonality Matters More Than You Think
Housing activity usually changes through the year. National seasonal analysis cited in the research shows that spring is typically the strongest buying season, with activity often peaking from April through June.
That means a home sitting for several weeks in winter may not send the same signal as a home sitting for several weeks during peak spring demand. As a homeowner, you should compare timing against the season, not just against a headline number.
This is one reason a straight month-to-month comparison can be misleading. A more useful read comes from comparing the same season, the same geography, and the same data source over time.
Relisting Can Distort the Picture
One of the easiest ways to misread the market is to look at a relisted property and assume it is fresh inventory. OneKey MLS explains that active listings start at 0 DOM, pending status pauses the clock, and CDOM follows the property across listing cycles.
It also notes that a Coming Soon listing can last up to 14 days without accruing DOM. So if you see a home return to the market with a low DOM number, that does not always mean demand is new or strong.
For homeowners, the lesson is to look past the surface. Listing history can tell a more honest story than the current DOM alone.
Sale-to-List Ratio in Rockville Centre
One of the clearest signals in Rockville Centre right now is how close homes are selling to asking price. Realtor.com reported a 100 percent sale-to-list ratio for March 2026, and Redfin showed 100.2 percent.
That suggests homes are generally selling at about asking price on average. It does not mean every home is getting bid up, but it does show that the market is still supporting well-positioned listings.
Nassau County was also at a 100 percent sale-to-list ratio, while New York state overall was at 99.8 percent. Rockville Centre is therefore tracking as competitive, with pricing still holding up well.
What Above-List Sales Really Tell You
Redfin reported that 43.8 percent of homes in Rockville Centre sold above list price, while 23.5 percent had price drops. That combination is important because it adds nuance to the market story.
If nearly half of homes are selling above asking, competition is still very real for attractive listings. At the same time, meaningful price reductions show that buyers are not accepting every price without question.
This is why the market looks seller-leaning, but selective rather than universal. Homes that are priced correctly and presented well can move quickly, while homes that miss the mark may sit longer or need adjustment.
What Homeowners Should Take From This
For most homeowners, the big picture is fairly clear. Rockville Centre remains competitive, inventory is still limited relative to demand, homes are generally selling near asking price, and market pace is closer to county norms than statewide norms.
At the same time, the market is not a one-way sprint. Price drops and longer listing times show that buyers still have leverage in certain situations, especially when a property is overpriced or not aligned with current expectations.
If you are thinking about selling, this means strategy matters. Strong demand can help you, but accurate pricing and smart positioning still make the difference between a clean sale and a listing that lingers.
A Better Way to Track the Market
If you want to follow Rockville Centre like an informed homeowner, keep your routine simple and consistent. Use the same geography each time, stick with the same source for month-to-month comparisons, and watch multiple signals together instead of chasing one headline number.
A practical checklist includes:
- Active listings
- New listings
- Days on market
- Price reductions
- Sale-to-list ratio
- Village versus ZIP versus county comparisons
This approach helps you avoid overreacting to one noisy data point. In a small market, a thoughtful read is usually more useful than a fast one.
Whether you are planning a sale now or simply trying to understand your position, clear local interpretation matters. If you want a direct, data-driven read on how your home fits into today’s Rockville Centre market, reach out to Steven Kramer for a confidential consultation.
FAQs
How should a Rockville Centre homeowner read inventory data?
- Focus on trends rather than one raw count, because public sites may show different totals and small changes can have an outsized effect in a compact market like Rockville Centre.
What do days on market mean in Rockville Centre?
- Days on market show how long homes typically take to sell, and recent figures around 46 to 48 days suggest Rockville Centre is moving in line with Nassau County and faster than the statewide average.
What does a 100 percent sale-to-list ratio mean for Rockville Centre homes?
- It means homes are selling for about asking price on average, which points to a competitive market, though not every listing is automatically receiving multiple offers.
Why do Rockville Centre market reports show different numbers?
- Public platforms use different methods, with some relying on MLS listing snapshots and others using valuation models or public records, so the numbers may differ even when the broader trend is similar.
Should Rockville Centre homeowners rely on ZIP code data alone?
- No, because the 11570 ZIP code includes some areas outside the village boundary, which can slightly blur the true village market when you compare trends.
What is the clearest market takeaway for Rockville Centre homeowners right now?
- The market remains seller-leaning and competitive overall, but buyers still have leverage on homes that are overpriced, slower to move, or not aligned with current demand.